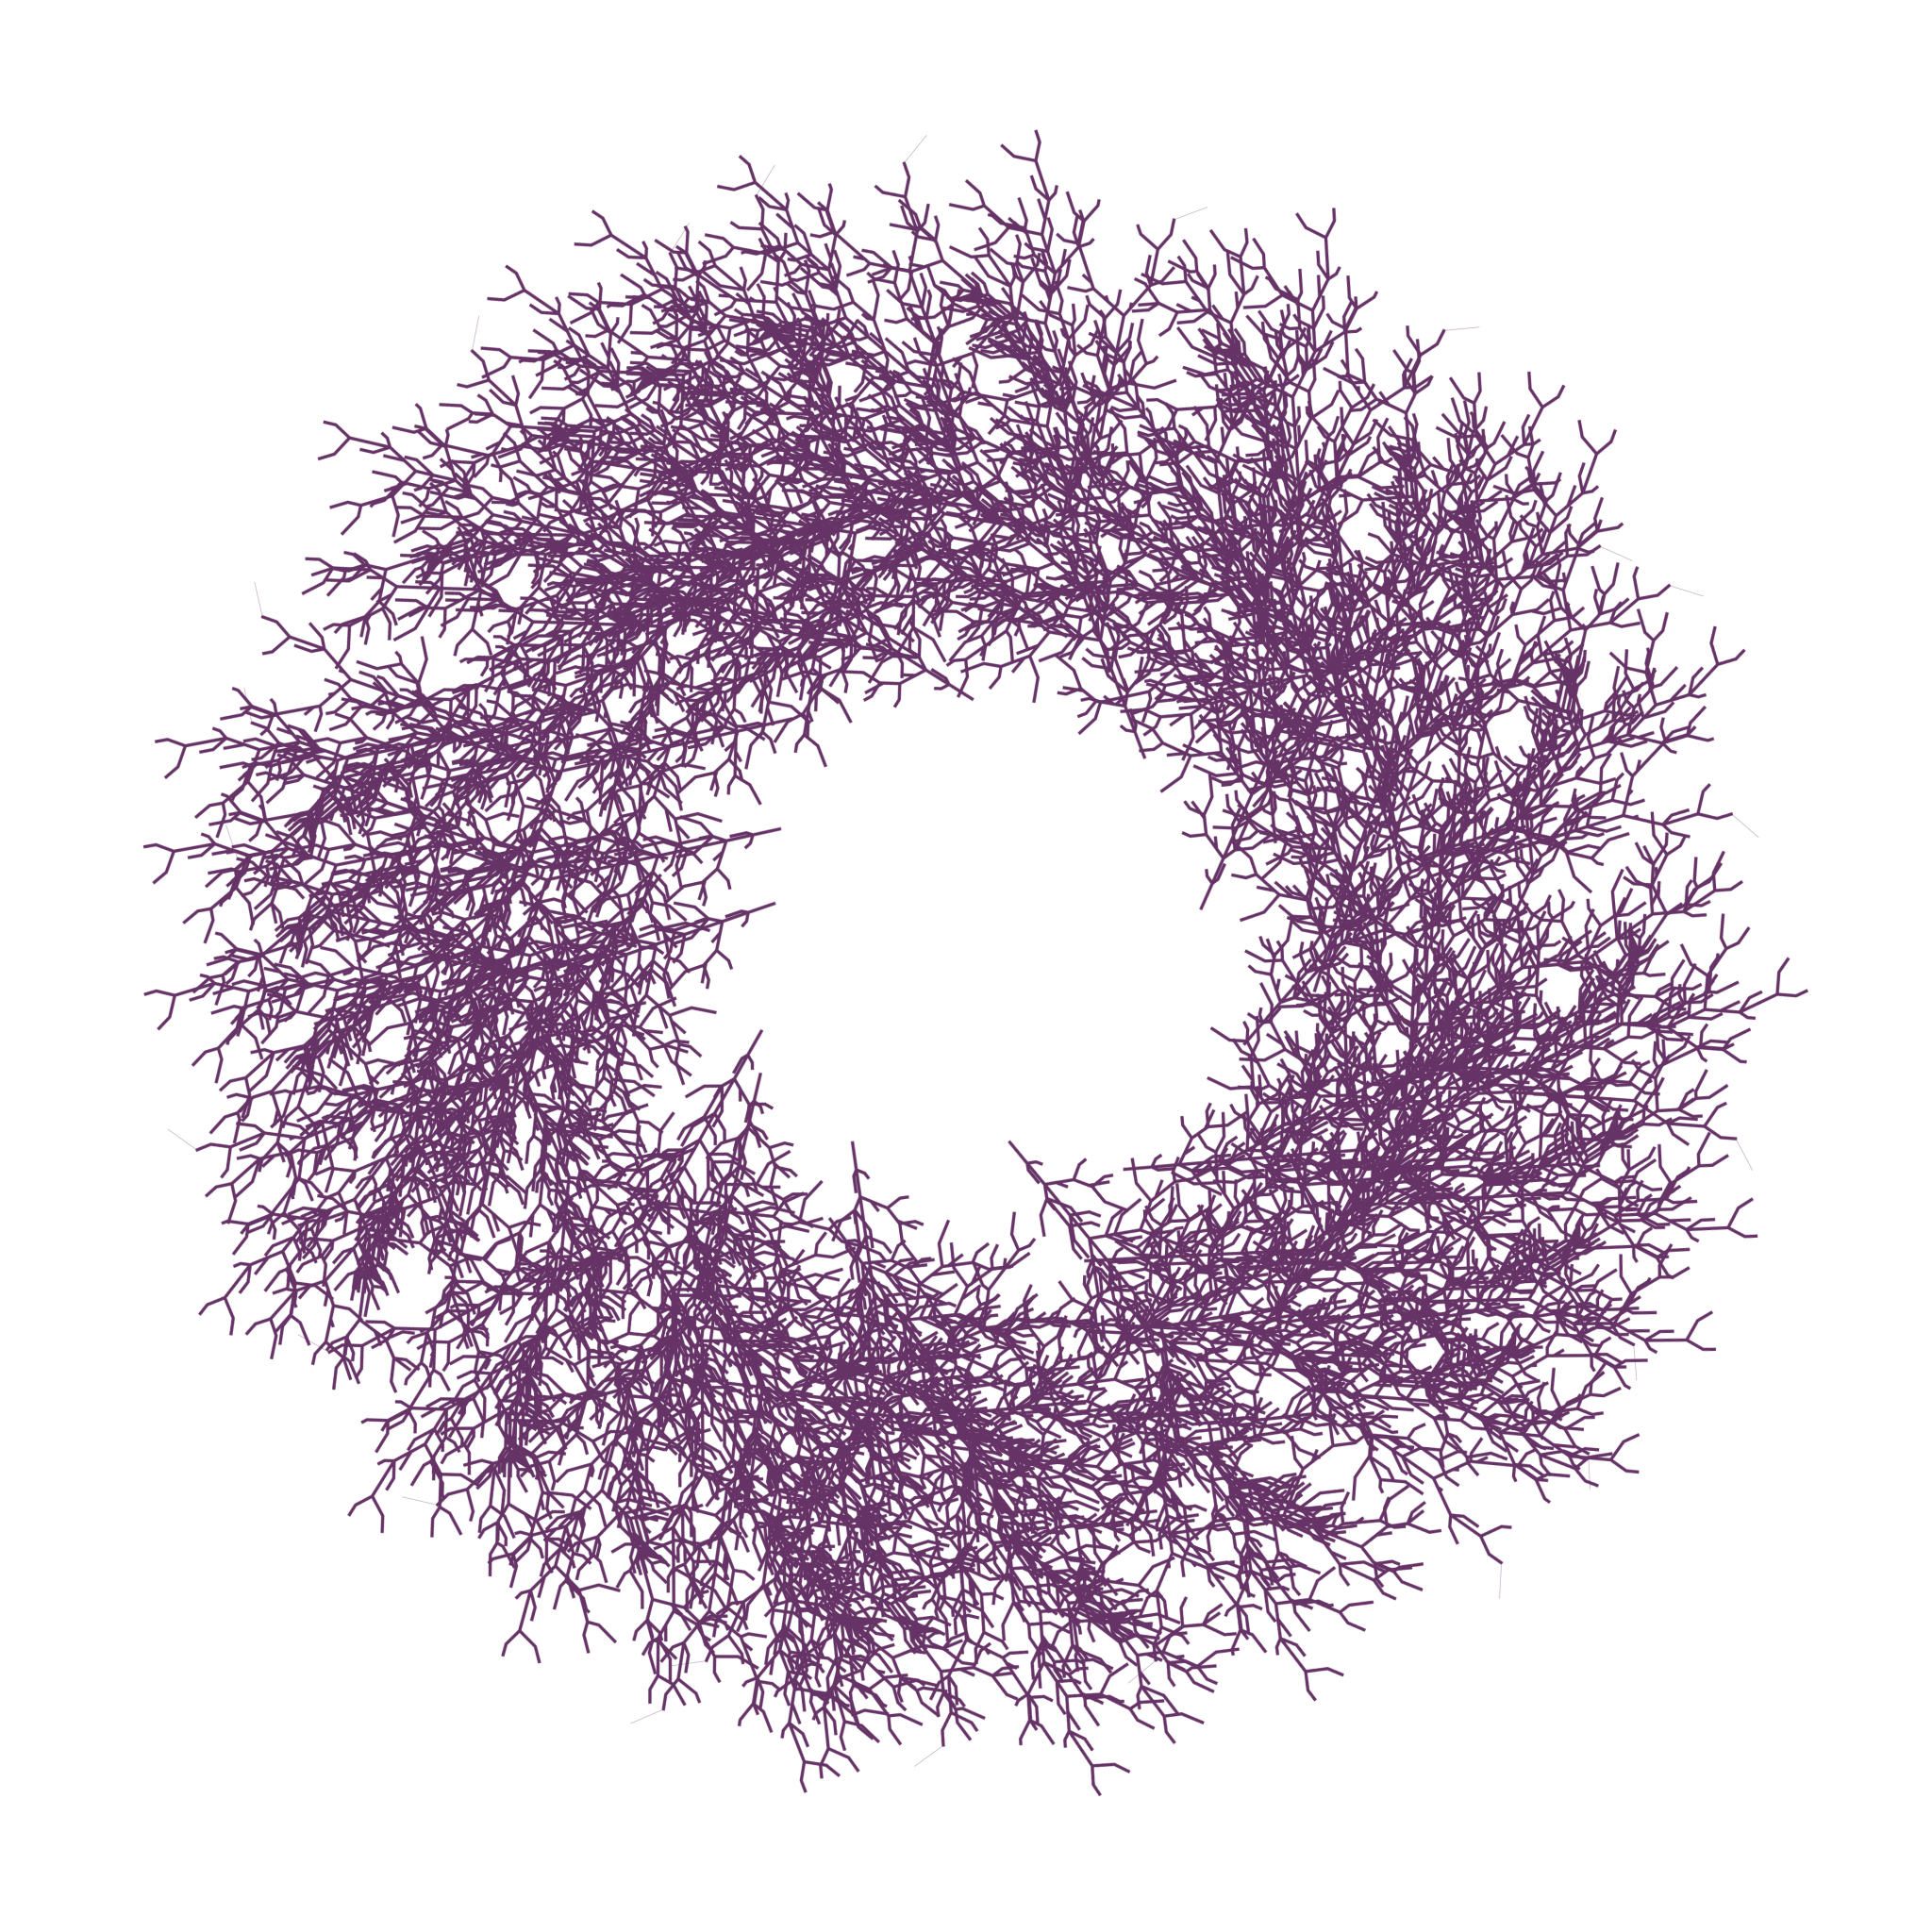
I made this last week.
A lot of you asked a lot of questions about this. You see, I have this problem, it’s called procrastination. When I’m supposed to do one thing, I end up doing something else entirely. The only way I get anything done is by always having too many things to do. It’s worked so far. I don’t know what I’ll do when it stops working.
click here to go directly to the graphics
There’s this book by Mumford, Series and Wright called Indra’s Pearls. I started reading it (I should probably say coding it) after reading this nice review in Bhavana Picking up Indra’s Pearls by Amritanshu Prasad.
In the very first chapter, the book kind of throws shade at people who use high end programming software like MATLAB and Mathematica. Well, not directly, but it does say that all the graphics in the book were generated using FORTRAN. If you’re one of those snobby people who get into debates about which programming language is better than the others, you know what the authors were doing when they said that.
Over the years, I have become this nice person who doesn’t look down on people who use Mathematica. This is mainly because I have found myself having to use it when I am short of time. I made a few of the illustrations in the book using Mathematica. But you see, I can’t put them out there. After going around making fun of people who use Python and readymade libraries, how could I? That would be like admitting that I understand the need for integrated packages and that sometimes there’s just not enough time to write your own libraries.
Anyway, I eventually reached the point where Mathematica, GNU Octave and my poor laptop could no longer do what I wanted them to. So I decided to write SVG using the good old C++. And something I create using C++, I can proudly show the world.
The image is of a Lindenmayer system tree rotated through multiples of an irrational angle. I took the angle of \(100\sqrt{2}\degree\) and the image was made using 13 iterations, if I had done any more iterations I would have filled filled the circle.
A lot of you were more interested in the Lindenmayer system, though (I was expecting interest in the filling the circle bit). It just so happened that I had the image with a transparent background. My initial thoughts were to use the picture Naru’s tail. Anyway, this gives me an opportunity to dump all the L-system images I had generated for the Maths is Fun: Fractals workshop. I made all of them using TikZ’s lindenmayersystems library.
The PGF-TikZ user manual documents the library pretty well. The algorithm itself is composed of simple, repetitive steps. At each step, you do one or more of the following: move forward, turn left by some angle or turn right by some angle.
click here to go to the rant part of the blog
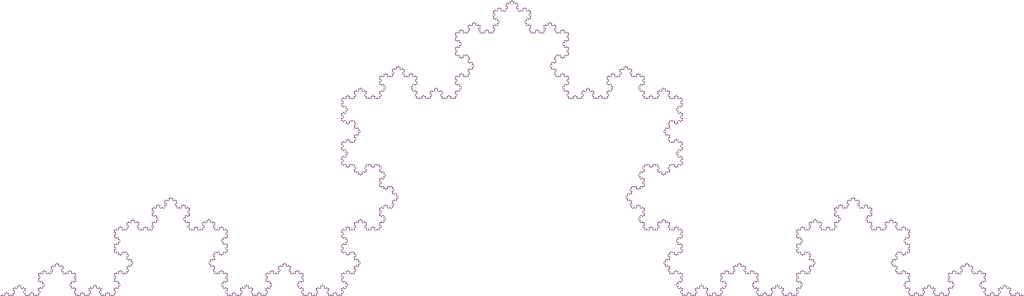
Let me give you an example. In an L-system, you can specify a rule such as \[F \to F+F- -F+F\].
Here every forward line \(F\) is replaced by four lines with turns in between. \(+\) means turn left by \(60\degree\) and \(-\) means to turn right by \(60\degree\). Applying this rule produces what’s popularly known as the Koch curve.
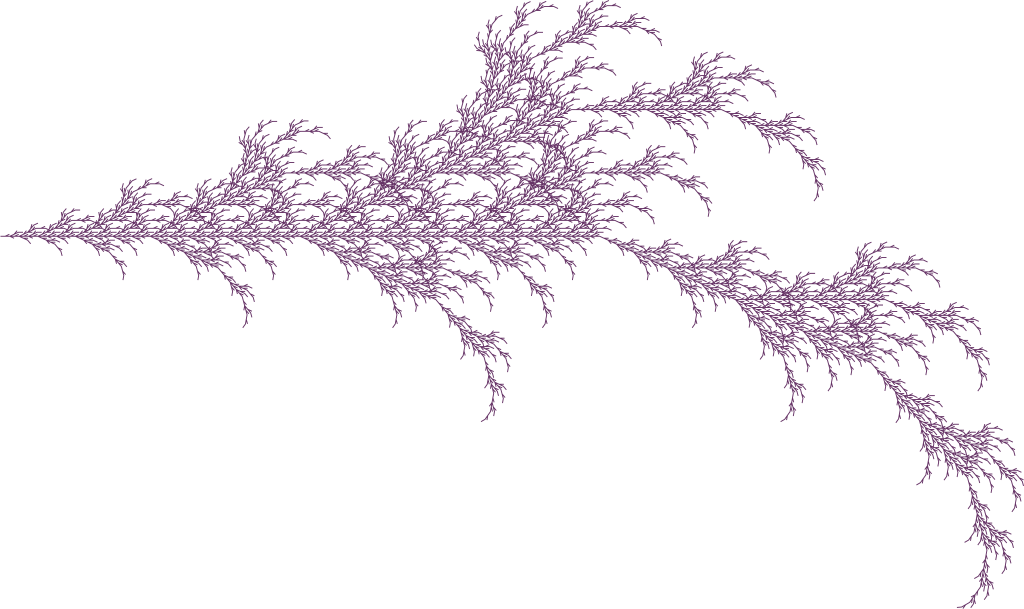
Fractal plant, \(F \to F[+F]F[-F]\), rotation angle is \(25\degree\). \([, ]\) means to save the position.
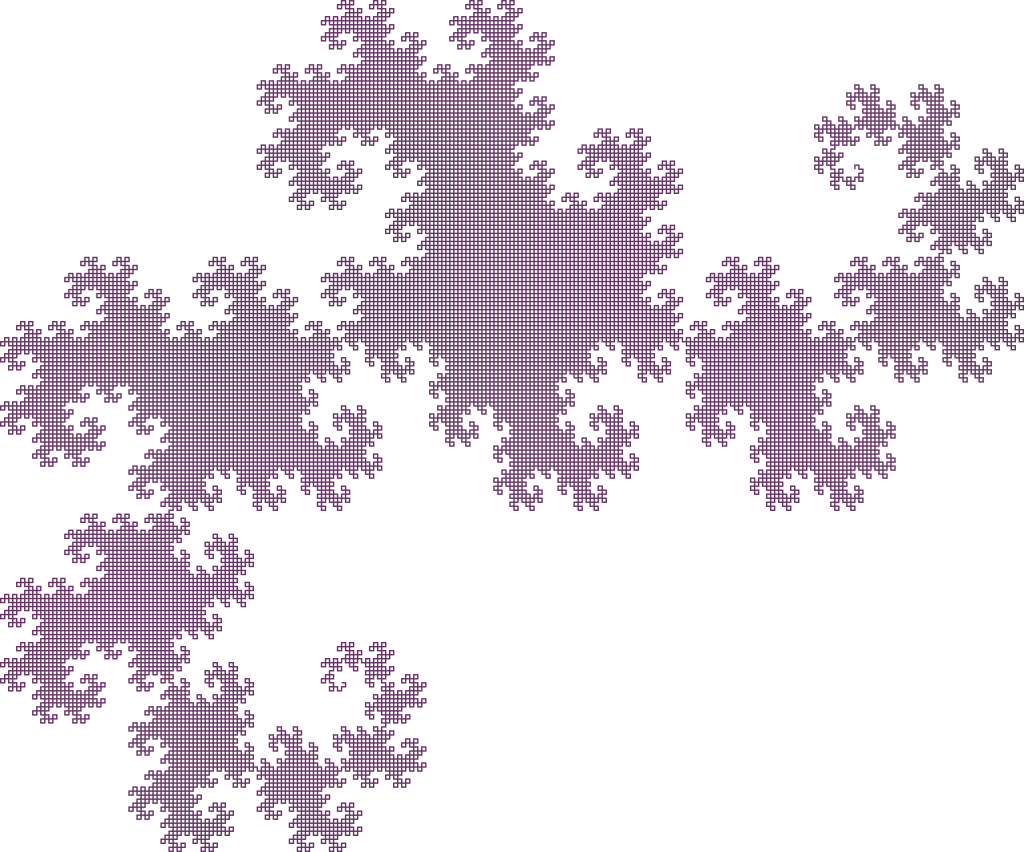
Dragon curve made using two rules, \(A \to A+X, X \to A-X\), rotation angle is \(90\degree\).
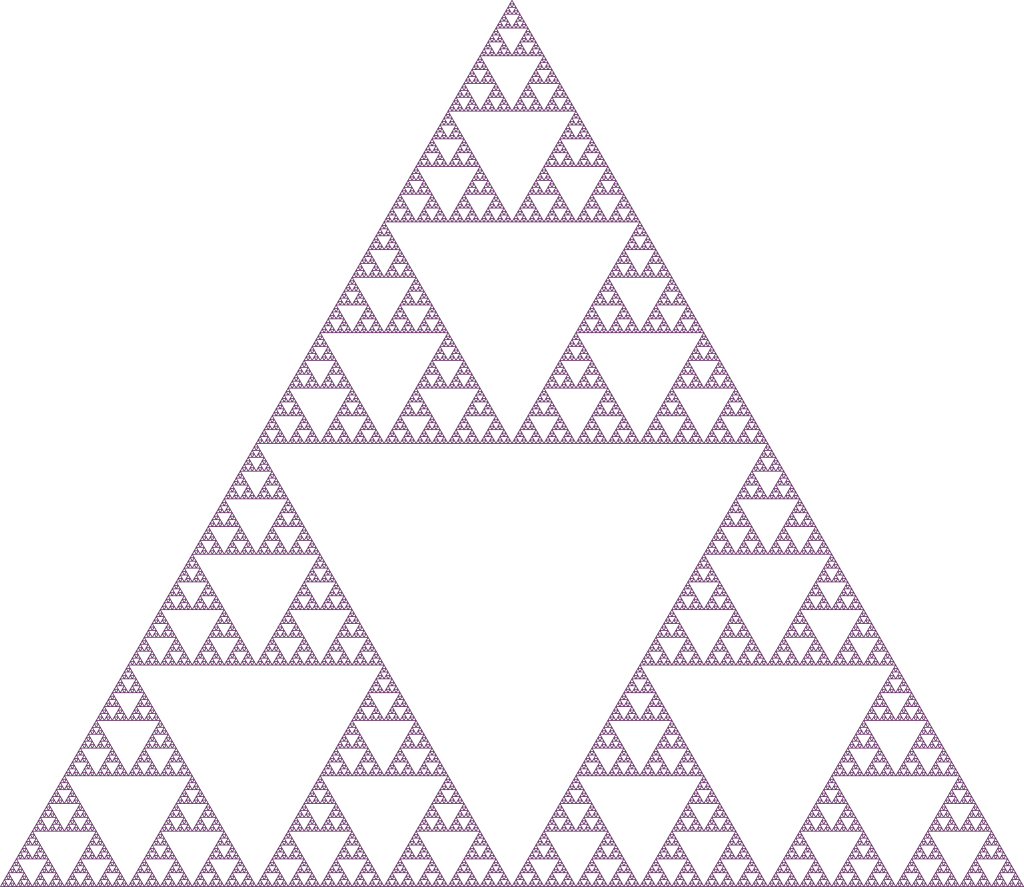
Sierpinski Gasket made using, \(A \to A-F+A+F-A, F \to FF\). Here \(A\) also means to move forward and rotation angle is \(120\degree\).
Penrose tiling can also be generated using an L-system grammar but not using TikZ. It simply fails for iterations \(>1\).
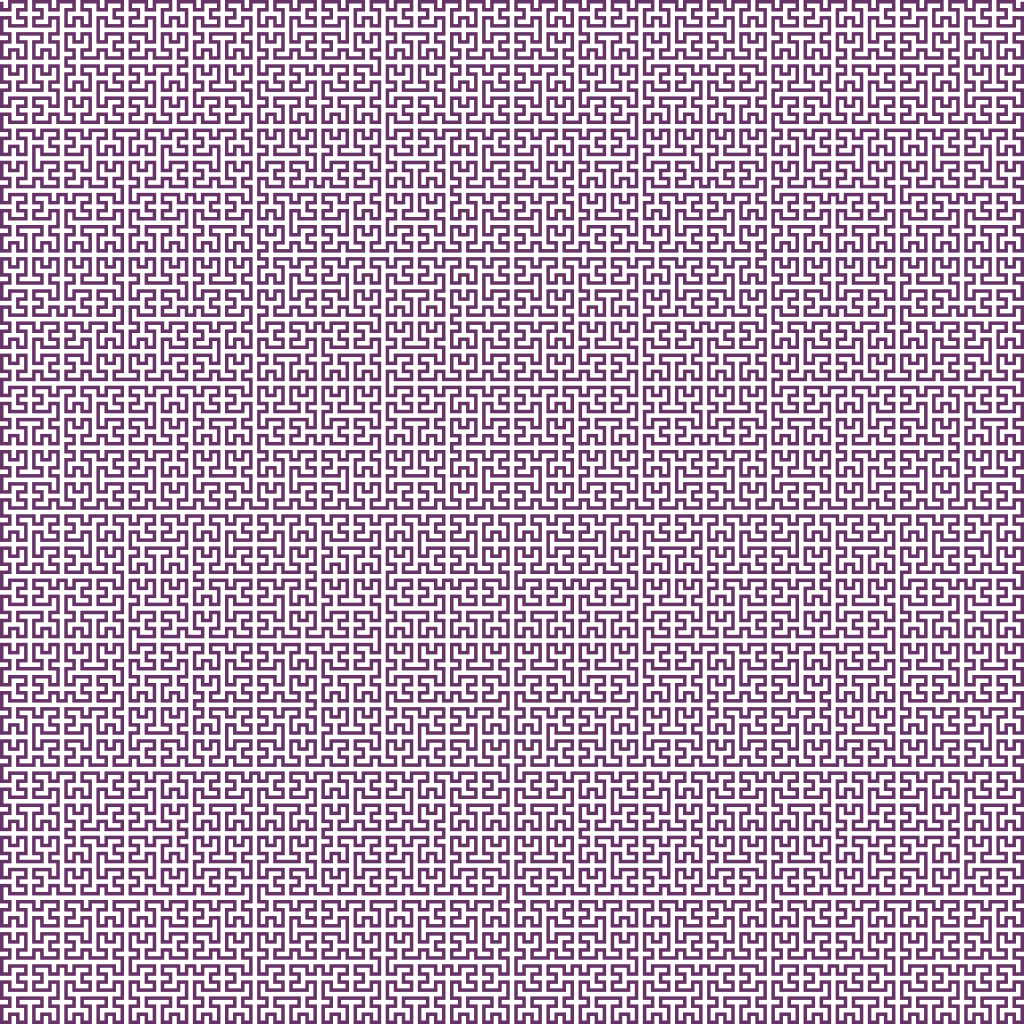
Hilbert curve made using \(A \to +BF-AFA-FB+, B \to -AF+BFB+FA-\).
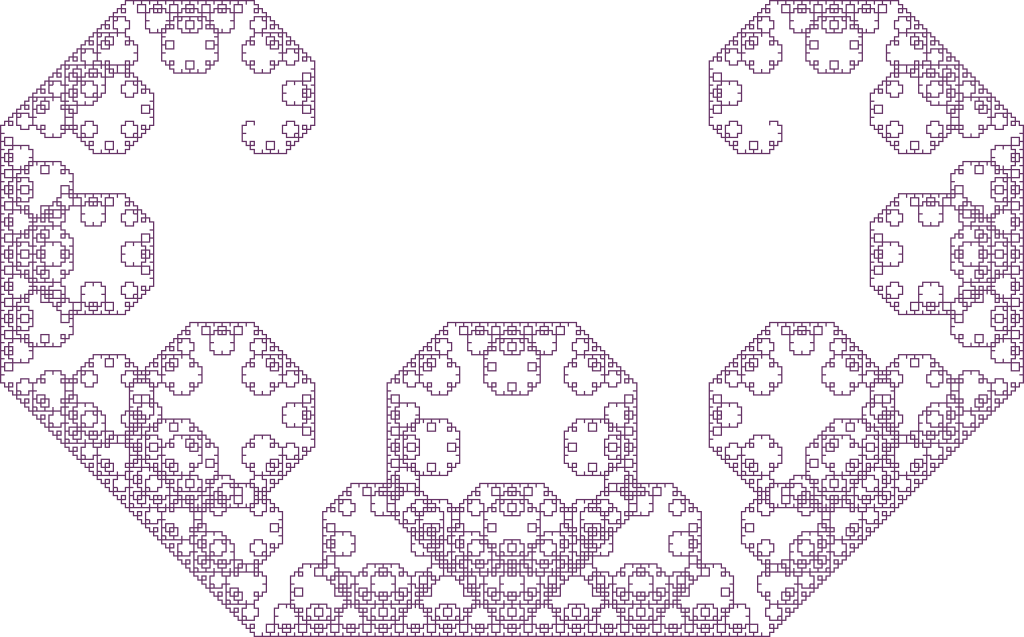
Levy C curve made using \(F \to +F–F+\).
Cantor set is not as good looking as all the fractal we saw so far, but has a lot of interesting mathematical properties. Generated using the rule \(F \to FfF, f \to fff\). Here \(f\) means to move forward without drawing a line.